Visualizing Production Planning with Asprova

“A picture is worth a thousand words.” This saying actually holds true based on scientific findings, because:
- The brain processes visual information 60,000 times faster than text.
- Approximately 40% of all nerve fibers connected to the brain are linked to the eye retina.
- In general, visual data comprises 90% of the information processed by the brain.
What Does Visuality Mean in Production Planning?
Many companies still conduct production planning through ERP systems or Excel spreadsheets. Hundreds or even thousands of production orders are managed on these spreadsheets. When we want to track thousands of work orders through spreadsheets, is it easy or difficult to evaluate the following?
- Is the resulting production plan realistic and implementable?
- Are there conflicts between material availability and resource capacities?
- At what level is synchronization achieved among production processes?
- What is the total production lead time?
- How effectively were work orders sequenced?
- Is it possible to evaluate different scenarios?
To be frank, managing this complexity with ERP systems and Excel is impossible!
Visual Production Planning with Asprova
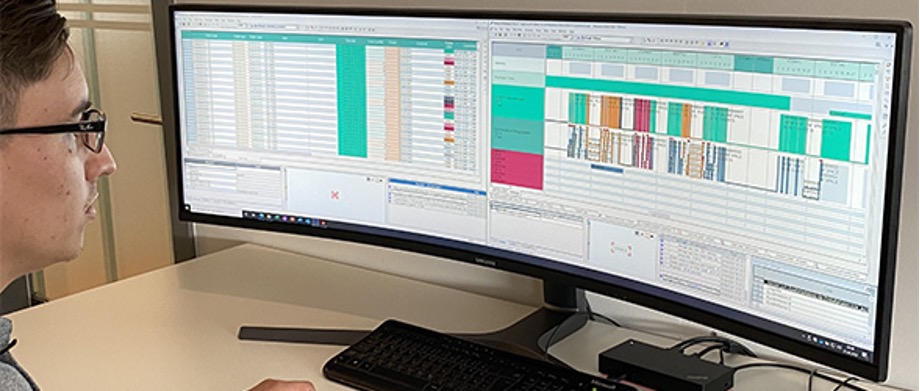
Many advanced planning systems (APS) are coded to operate on two separate databases: one for creating the user interface and the other for managing the scheduling process. The uniqueness of the Asprova advanced planning system lies in being coded to operate on a single database for both the user interface (GUI) and the scheduling engine. The greatest advantage of this situation is that production processes are visualized and scheduling is calculated in real-time.
Examples of Visual Planning with Asprova
Composite visualization for detailed examination: Inventory levels and machine Gantt chart are scheduled simultaneously.
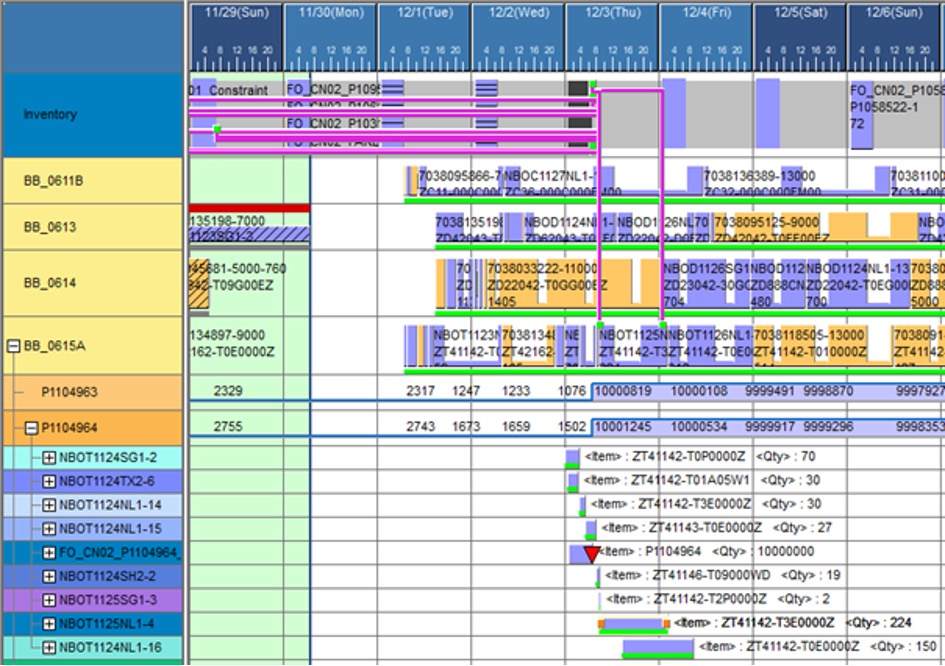
Composite visualization for detailed examination: Inventory levels, resource loads, and operation sequences are viewed simultaneously.
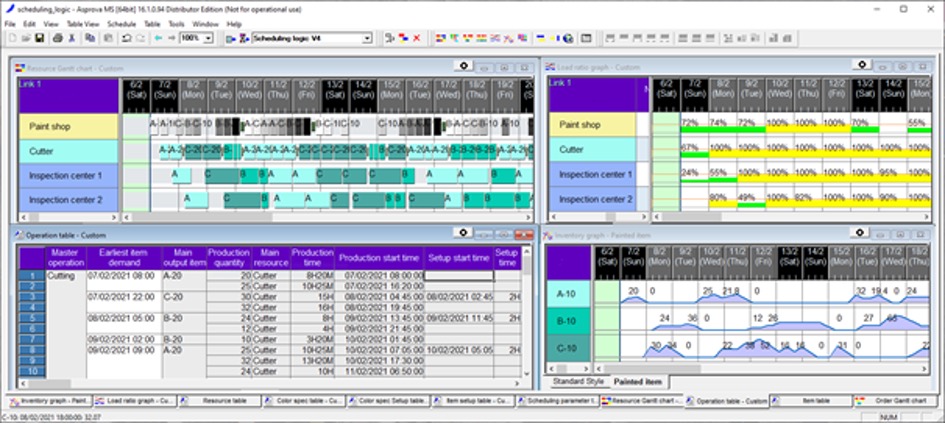
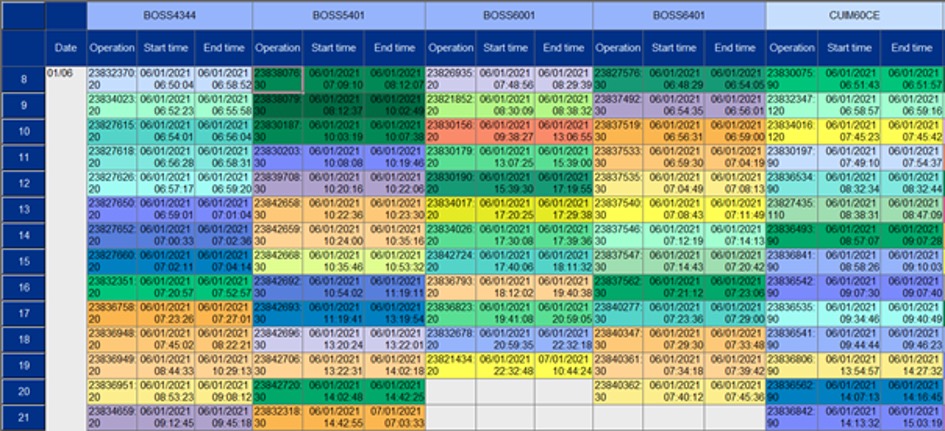
Resource Utilization Gantt Chart: Optimized scheduling is confirmed with colors.
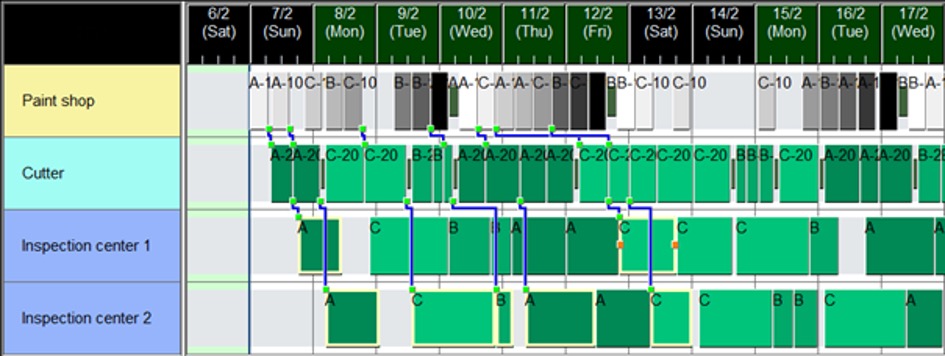
Order-Based Gantt Chart: Useful for controlling the synchronization of parallel processes.
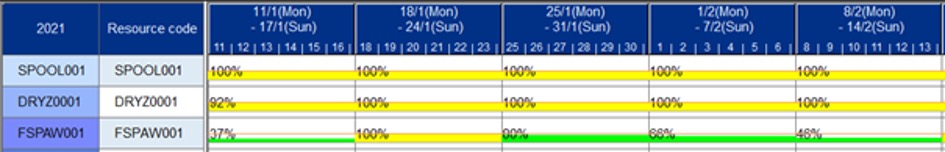
Resource Capacity and Workload Diagram
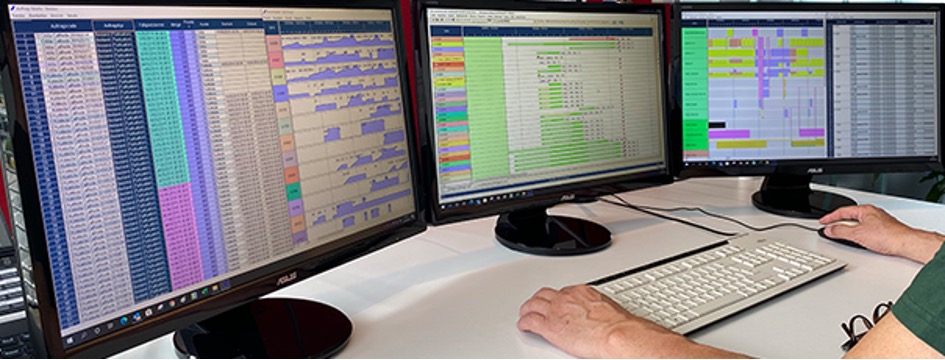
All graphs and diagrams can be displayed in summary tables.
Visualizing the production plan with Asprova provides the following benefits:
- “Look into the future” through simulation: This provides a general overview of your order status and delivery times for each month, enabling front-loading management and determining the most cost-effective planning/work scenario.
- Provides an overview of order status and delivery dates for all current and planned production orders.
- Bottleneck management: Bottlenecks are identified at an early stage, preventing constant “firefighting” throughout the day.
- Sequencing of work orders and synchronization status of production processes are displayed graphically, enabling easy control.
- Visual connections are established between production processes and material inventory, making it easy to understand why inventory levels fluctuate.
- A clear picture of resource capacity load and availability is revealed.
- Possible completion dates for urgent orders are calculated and their impact on other orders is reported.
Asprova is an advanced planning system trusted by leading lean manufacturers in all industrial sectors worldwide. There are numerous success stories in various sectors, including automotive, machinery manufacturing, aerospace, shipbuilding, electronics, pharmaceuticals, process industries, food and beverage, metal and non-metal industries, and more.
The original article written by Asprova AG Managing Partner Keiji Fuiji has been translated into Turkish. To watch sample usage scenarios prepared by Dijitalis, the official distributor of Asprova in Turkey, visit our YouTube channel.